Beyond Averages: Unlocking Insights with Percentiles in Web Analytics
How Scoby Analytics Helps You Understand Your Website Visitors More Deeply With Percentiles
6 min read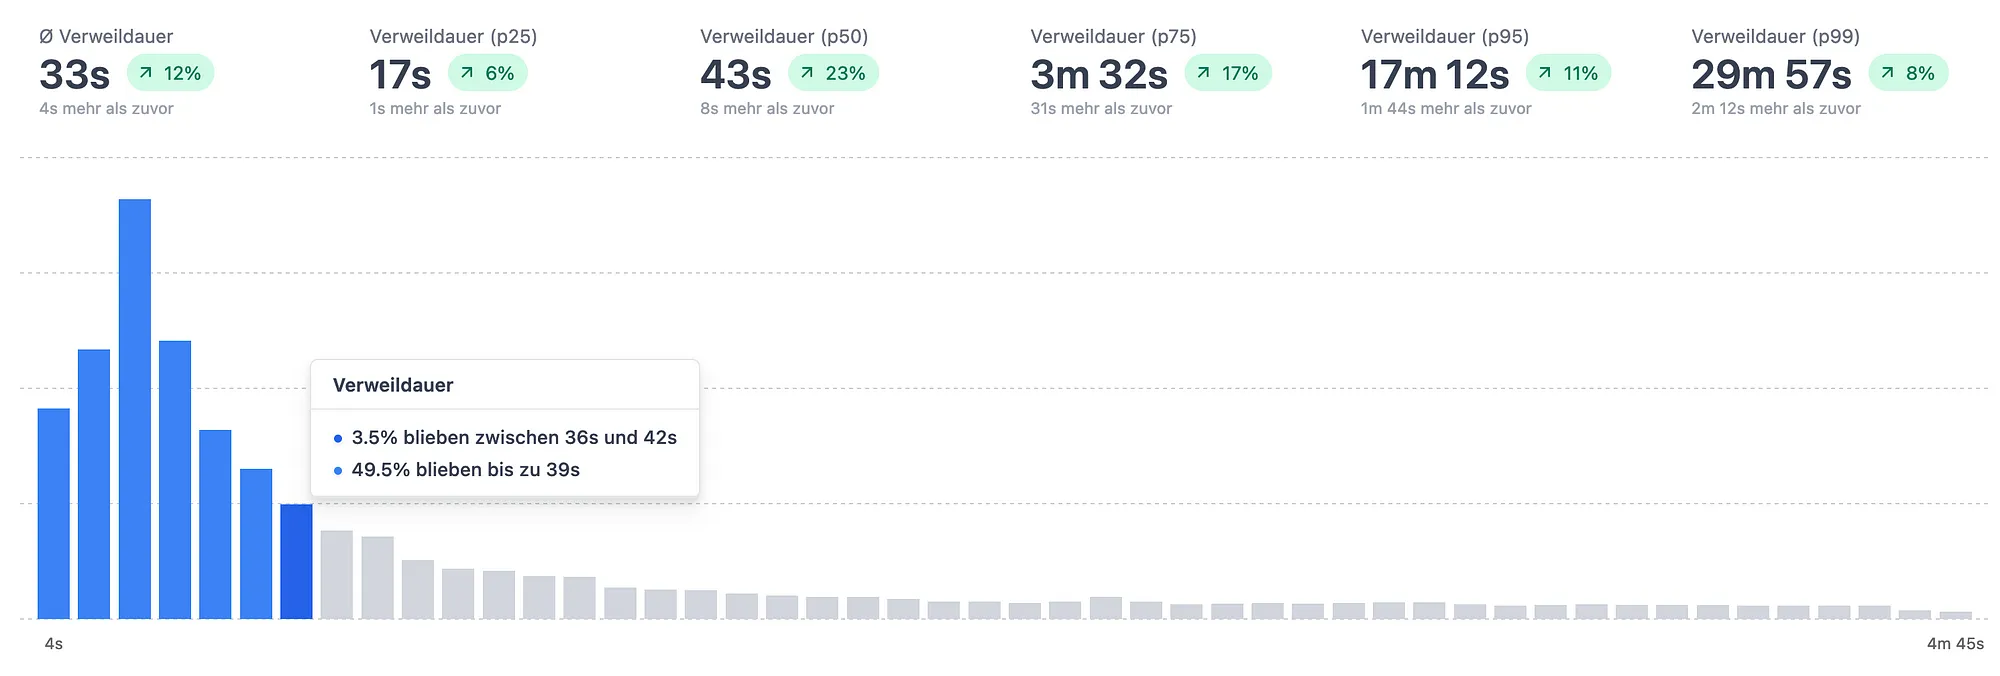
When it comes to web analytics, we often default to relying on averages to summarize user behaviour. Average time on site, average page views, average bounce rate — we've all used these metrics. However, they are not always the best indicators of overall trends. Welcome to the world of percentiles, where we at Scoby Analytics believe that real insights lie.
Averages vs. Percentiles: A Layman's Analogy
Imagine you're a teacher, and you want to understand how your students performed on a test. You calculate the average score, but does that tell you everything? What about the student who studied hard and aced the test or the one who didn't study and scored low? The average glosses over these details, giving you a middle-ground number that isn't representative of everyone's performance.
This is where percentiles come in handy. They can offer a fuller picture by breaking down the class performance into different segments. The 25th percentile shows you the score below which a quarter of the students fall. The 50th percentile (or median) tells you the score that half the students achieved or exceeded, and so forth.
Applying Percentiles to Web Analytics
For web analytics, consider the 'time spent on a website' metric. The average time spent could be skewed by a few visitors who spend an unusually long or short time on the site. But if we look at the percentiles, we get a more nuanced picture:
- The 25th percentile tells you the minimum time a quarter of your visitors spend. Changes in this number might indicate short-term trends — like a recently published blog post that's catching attention.
- The 50th percentile (median) offers a balanced view, unaffected by extreme values. This could represent a typical user's behaviour on your website.
- The 75th percentile provides insights into your more engaged users who spend longer periods on your site.
- The 95th and 99th percentiles represent the behaviour of your most dedicated users who spend a lot of time on your site. Changes to these numbers over time could suggest long-term trends, such as the success of a new feature launch or loyalty program.
Scoby Analytics: Going Beyond Averages
At Scoby Analytics, we provide you with all these percentiles (25th, 50th, 75th, 95th, and 99th) to help you understand your website visitors more deeply. We offer a chart showing the distribution of time spent on your website, but we also include the 'legacy vanity' averages to complement your existing reports.
Notably, our analytics are not influenced by adblockers or require visitor consent, thanks to our innovative consent-free design. This means you get a complete picture of all your website visitors' behaviour, helping you make data-driven decisions to improve your product.
Furthermore, we invite you to explore percentiles using our demo data available for free. It’s a great way to familiarize yourself with the potential of this powerful tool in web analytics.
You see, understanding your users goes beyond averages. With Scoby Analytics, you have access to the tools and high-quality data you need to discern both short-term and long-term trends, helping you run a successful product. The power of percentiles awaits you.
Start exploring today, and discover the real story behind your website data!